Analysis of Trends in the Cuyahoga County Economy in the 21st Century
Methodology
To create this analysis, I used Excel and R to collect data on Cuyahoga County and create data visualizations. All of my data is from the Federal Reserve’s public data repository (FRED). After getting several CSVs from FRED with yearly stats like GDP, population, PCPI, and median household income, I merged the data into one spreadsheet. I then sourced inflation data and made inflation adjusted values on the spreadsheet as well. Moving to R, I started exploring a variety of connections using the ggplot2 package, ultimately honing in on the graphs featured below. I also developed a uniform style/aesthetic block of code to add to each chart. Linked to download here are my Excel spreadsheet and my R markdown file for reference.
Introduction
Depending on one’s proximity to the Cleveland area, perceptions of the city vary wildly. On the national scale, Cleveland falls victim to wider Rust Belt narratives- a city marred by post-industrial economic decline, a shrinking population, and aging infrastructure. These narratives are further influenced by cultural factors like the futility of the local sports teams and constant “Mistake on the Lake” type imagery. If one talks to a local however, they will often encounter a strong sense of pride, bordering on defiant rejection of these national narratives. They will cite a thriving revitalization effort in several city neighborhoods, a strong food and nightlife scene, and steadily improving economic opportunities. With the gap between local and national perception of the city, I will examine economic data from this century to decipher which of these narratives fit more closely and what these statistics show us about living in the area.
Some important notes before I dive in— I am using Cuyahoga County data as an analogue for the Cleveland area. This data captures the city proper and many surrounding suburbs. However, this data captures more than the city proper but less than the metro statistical area. I will take this into account in my analysis. Unfortunately, the Federal Reserve stopped publishing specific data for the Cleveland-Akron MSA in 2018. This includes consumer price indexes to measure inflation, so I am using the regional “Urban Midwest” CPI data throughout my analysis for consistency. My analysis ends in 2023, as this is the last year from which all statistics I am using are published.
Initial Macro View of the Economy
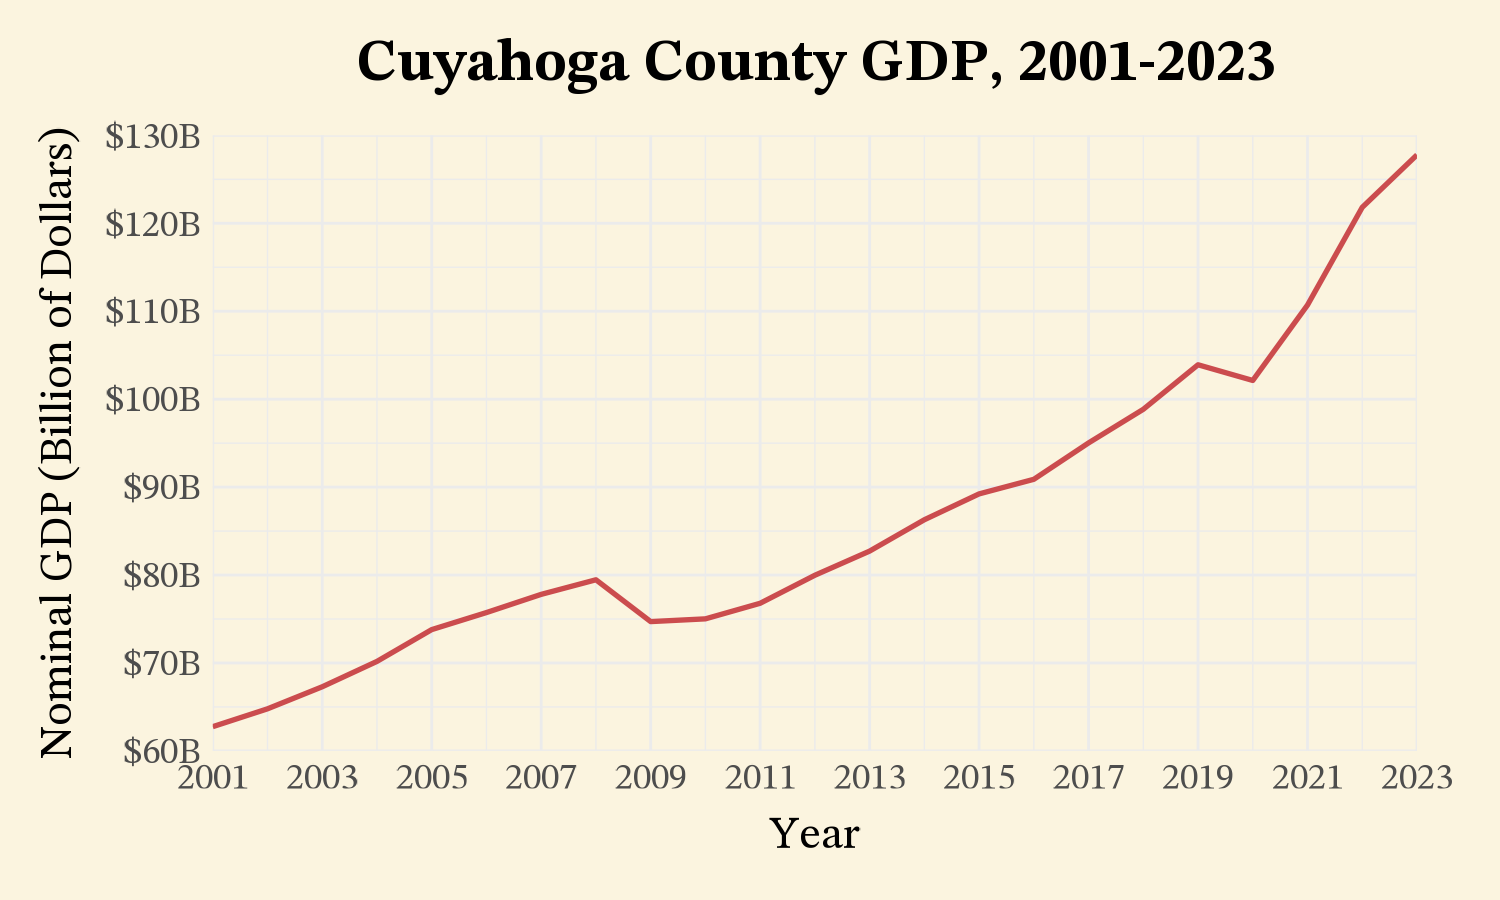
Between 2001 and 2023, the Cuyahoga County GDP grew by about 103.5%. While this chart gives the initial impression of strong economic performance, this lags significantly behind the nationwide growth of 166%. There are several explanations for this, but chief among them is the decline in population.
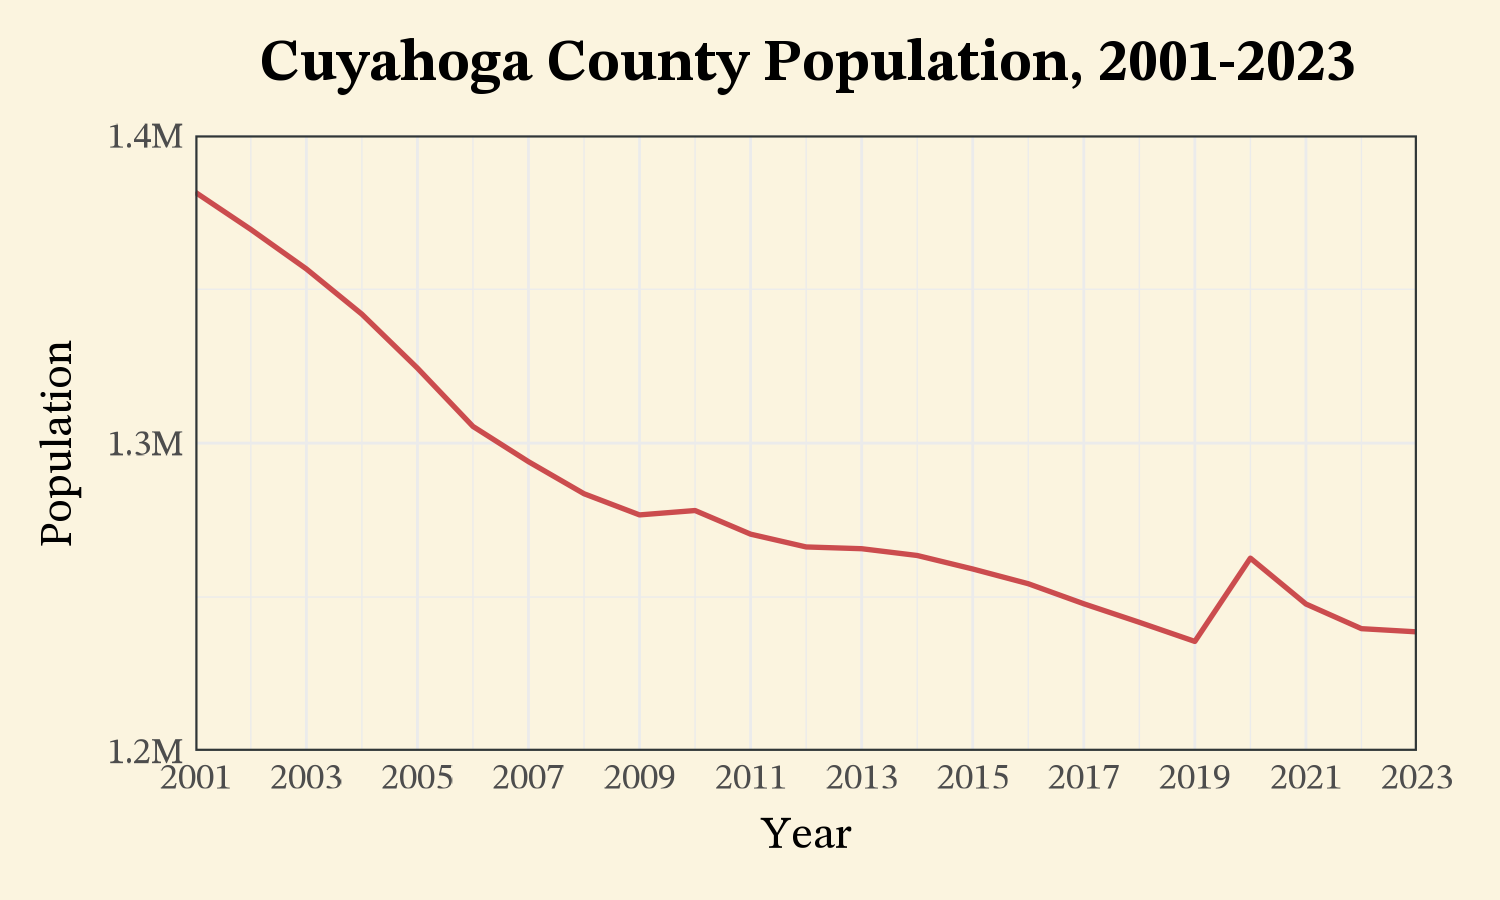
During the period of study, the Cuyahoga County population has declined by over 10%, compared to a nationwide 18% increase in population. This population decline was much more stark at the beginning of the century, but has stagnated recently, even starting to grow in 2020 and 2021. This population decline can be largely be attributed to citizens leaving Northeast Ohio entirely, but continuing suburban sprawl also contributes, with people staying in the metro statistical area but leaving the county.
With these initial impressions in mind, the lagging GDP growth does not tell the full story. It is necessary to adjust for inflation and also take a look at per capita and individual income statistics to achieve a richer understanding of the economic dynamics of Cuyahoga County.
The Cuyahoga County Economy in Context
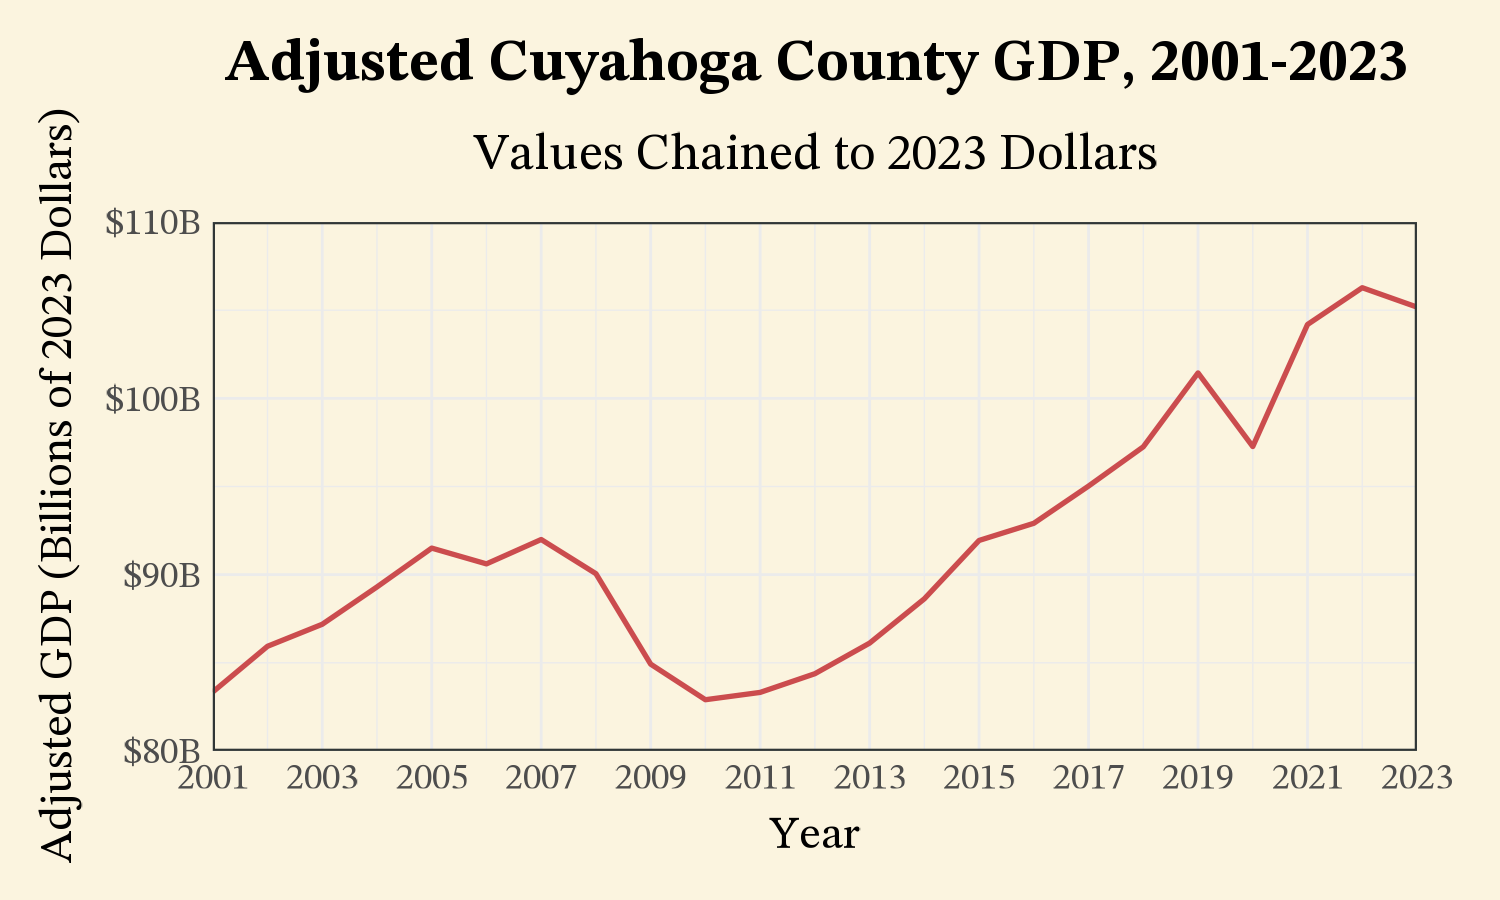
Adjusting for inflation gives a much clearer picture of how the overall size of the economy has changed since 2001. After starting the decade with modest growth, the economy saw a severe downturn with the Great Recession. Following the recession, the economy has seen consistent growth, save for the pandemic years. The county economy has significantly outpaced population decline, an indicator of gains in efficiency. Inflation adjusted GDP per capita is an even better illustrator of this trend.
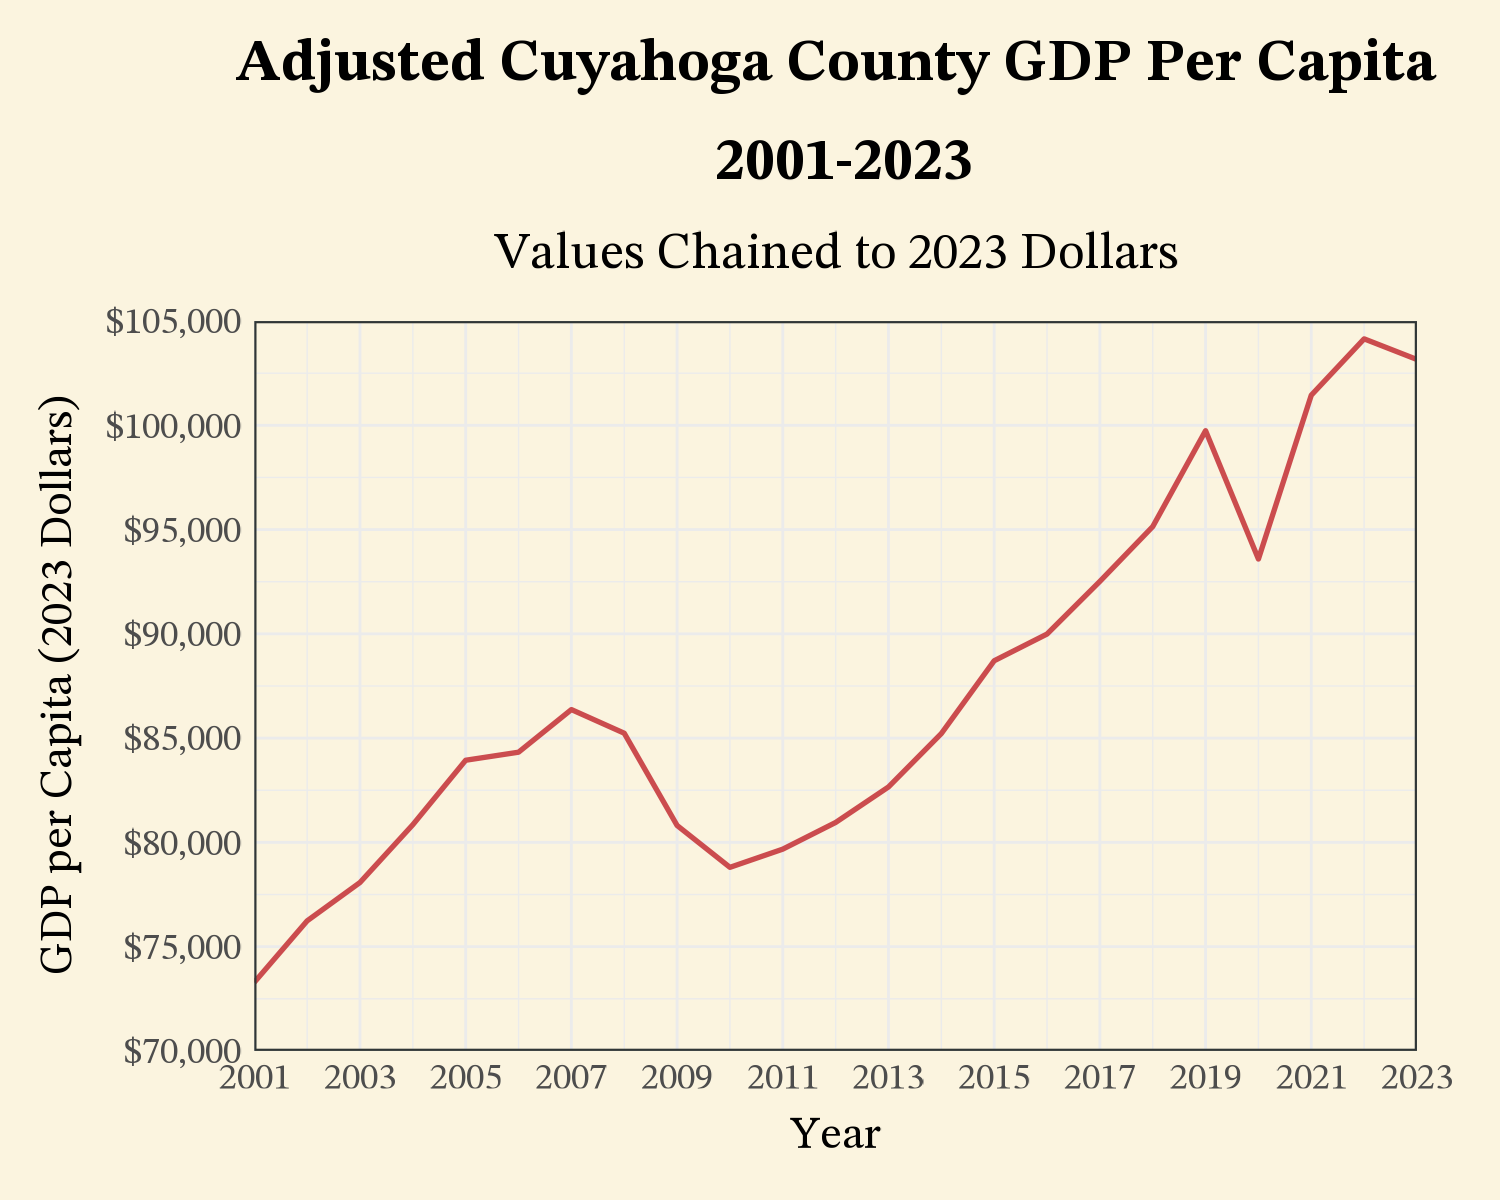
The GDP per capita in Cuyahoga County has steadily increased in non-recession years with massive growth in the 2010s. This indicates large gains in production efficiency. Despite a declining population and the perception that the means of production that classically stimulated the city were leaving, growth in areas like healthcare and revitalization efforts in the manufacturing industry have contributed to a county economy that is producing more per person than ever. One would expect this growth to be a harbinger of increased standards of living for county residents, but is this the case?
Where is the Money Going?
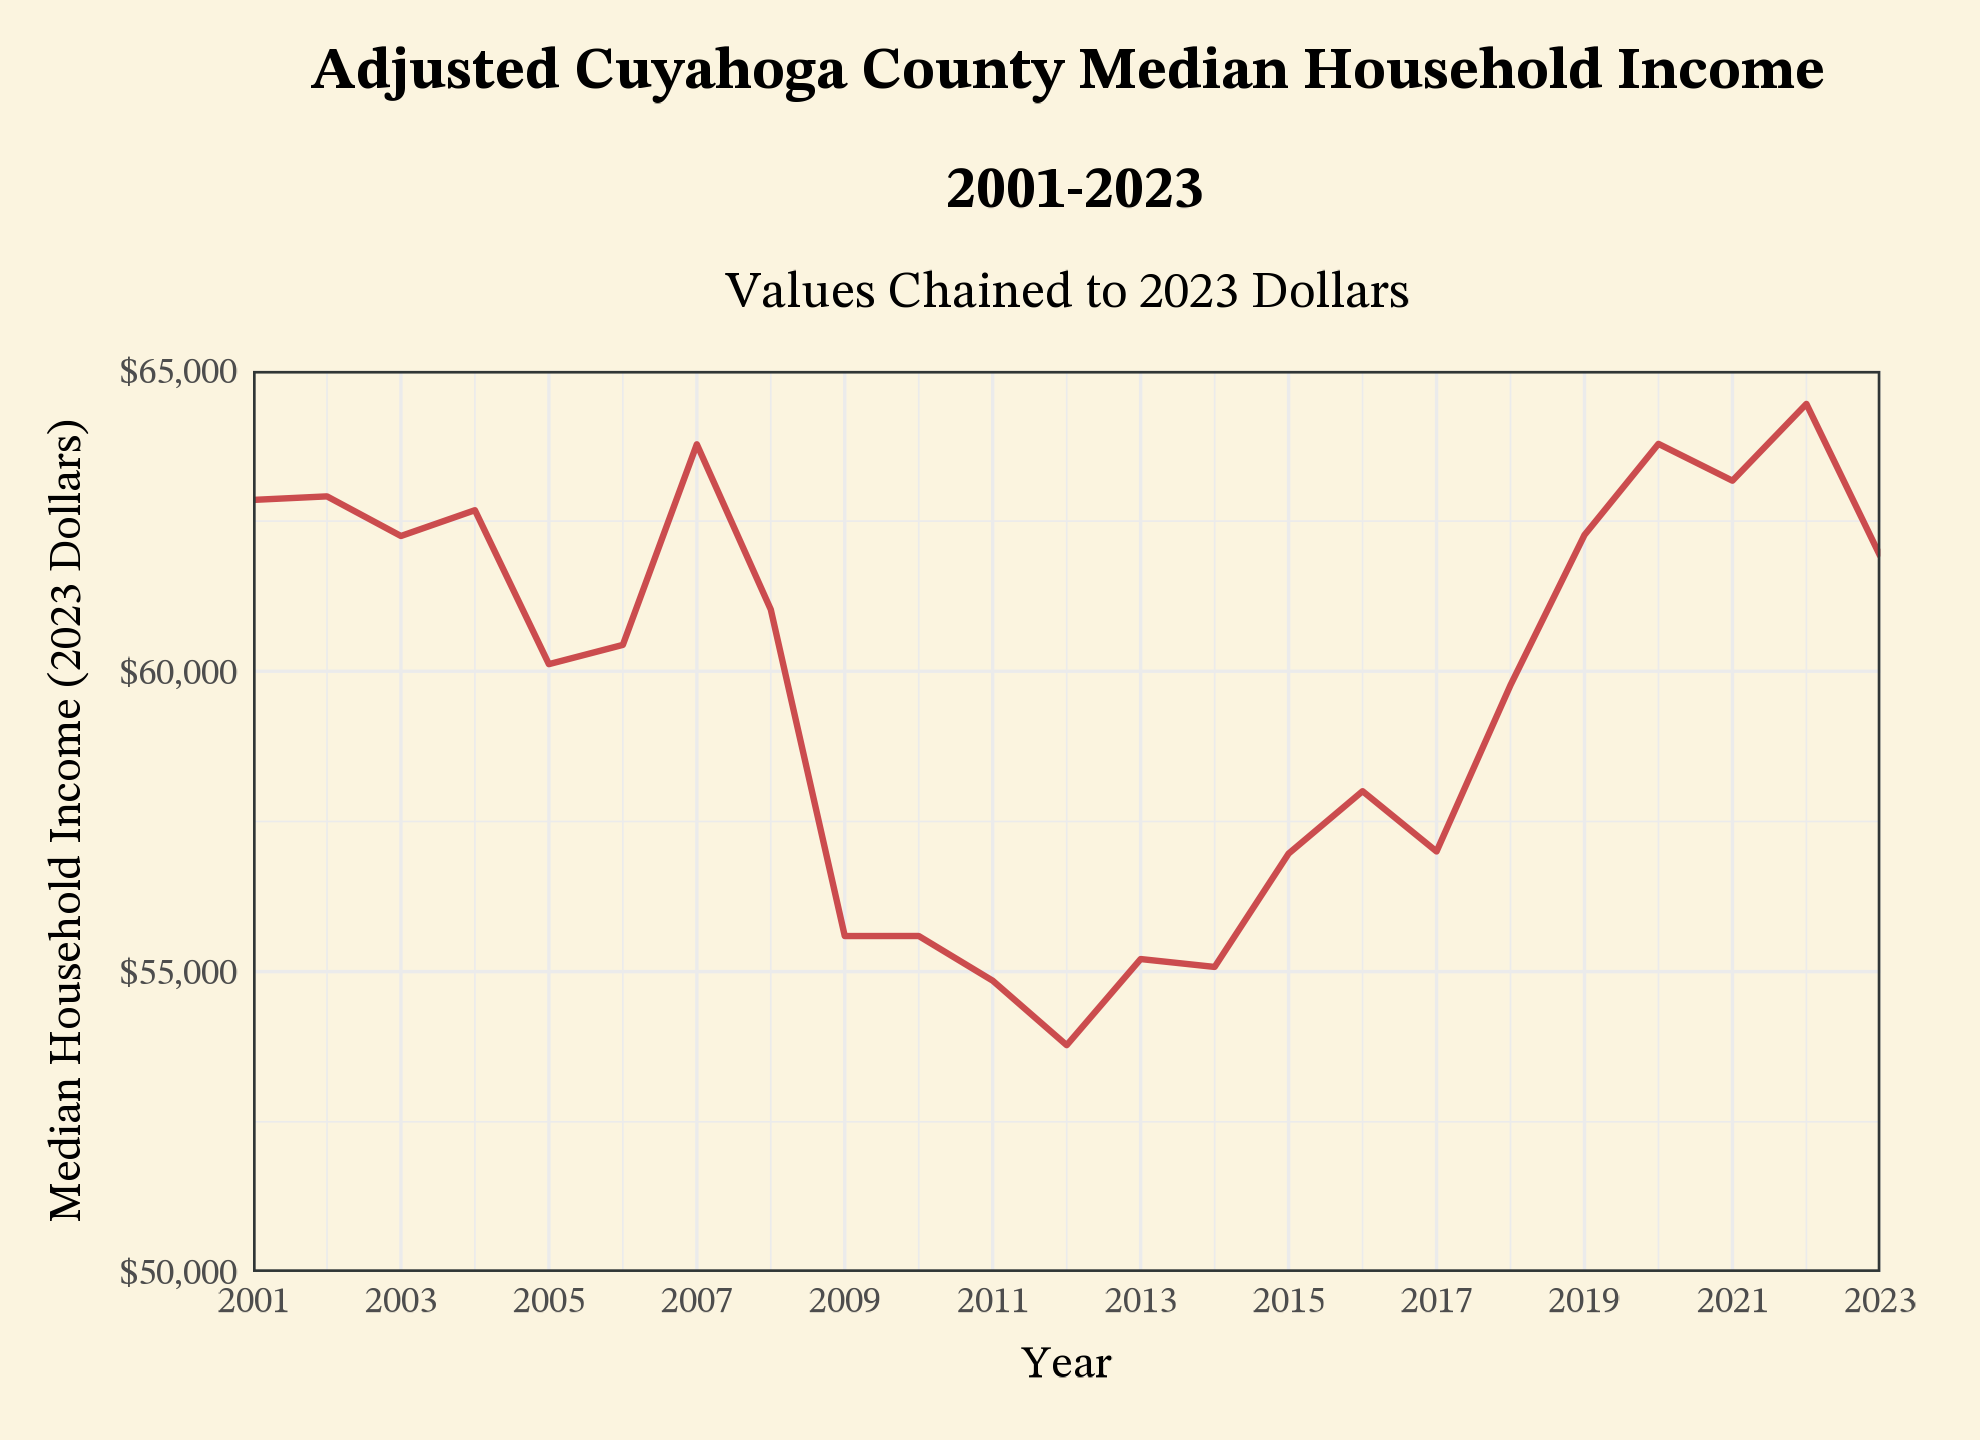
Despite the overall growth of the economy, the median household income has actually fallen in the county since 2001, recovering to early 2000s levels in recent years following a major dip during the recession. This indicates that the growth in the county economy is not reaching its residents en masse. On a national level, statistics like this are explained by increasing wealth inequality, with economic gains disproportionately going to the rich. While there are elements of this phenomenon in Cuyahoga County, the next graph shows that increasing wealth inequality is not the entire story here— at least not within the county.

Per capita personal income (PCPI) shows average income rather than median income. If wealth inequality was the sole driver of money produced in the county not reaching the median household, we would expect PCPI to be unaffected, however PCPI lags significantly behind the GDP per capita. In 2001, the gap between PCPI and GDP per capita was 28.6%, while in 2023 the gap was 33.7%. This means that the economic value produced in Cuyahoga County has consistently left the county, but is now doing so at a higher relative rate.
Conclusions
First and foremost, the idea that the economy in Cuyahoga County is in decline is a reductive and outdated one. While the population continues to shrink, it is doing so at a much slower rate than in the past and it is safe to say that the city of Cleveland and its surrounding areas have largely recovered from the industrial decline of the latter half of the 20th century. Cuyahoga County has seen economic growth in large part thanks to a booming healthcare industry and a revitalization of manufacturing, especially higher skill and technical manufacturing. This economic improvement is seen in action with investment in refreshing dated real estate in the city and its surrounding areas, with previously aging neighborhoods like Ohio City, Tremont, and Detroit Shoreway as lively neighborhoods with renewed culture. There are issues with these changes that are beyond the scope of this analysis, but from an economic perspective this investment is a strong indicator of confidence in the area’s future.
While there are many positive takeaways to be had in the 21st century Cuyahoga County economy, there are still concerns with these economic gains not making it to average people. For every burgeoning neighborhood, there are also neighborhoods that continue to age and remain rife with poverty. But what is stopping this economic gain from improving statistics like median household income? There are several possible explanations, all with varying degrees of impact.
One aspect of GDP that fails to be reflected in resident income is business capital. The industries that are driving growth like healthcare and manufacturing are highly capital intensive. This means that these businesses have a high rate of retained earnings for reinvestment, so the economic production never reaches the people in the area. Similarly, there are many corporate offices in the area that produce profits that contribute to the GDP, but exit the county as they go to shareholders. This is not an issue unique to Cuyahoga County, but the nature of industries and labor that dominate the economy means that many of the gains in the economy are unrealized for locals.
A significant factor in this gap that is difficult to parse with available data is the presence of suburban commuters. While the Cuyahoga County dataset includes some wealthy inner ring Cleveland suburbs, there is a significant amount of people who work in Cuyahoga County who live in suburbs in Geauga, Medina, Lake, Lorain, and Summit counties. Commuters from these areas often include some of the highest earners in the county, which causes an outflow of income produced in the economy.
Unfortunately, data that is granular beyond a county level is harder to come by, but the trend of money flowing out of its area of production to surrounding areas is further exacerbated when considering economic value produced in Cleveland proper and going to wealthy suburbs that still reside in the county, but are not part of the city of Cleveland. Whether or not this is a problem is a complex and subjective issue, but there is no doubt that much of the value produced thanks in part to Cleveland infrastructure is not remaining in the city.
Despite this outflow, the overall health of the area’s economy is still on the upswing. Continued investment in Cuyahoga County has pushed it past a shadow of its industrial peak into an area that has a highly modern and productive economy. The narrative espoused by some locals that paint a picture of a newly thriving city has truth to it, if lacking nuance. Again, beyond the scope of this research, there still remains massive issues with inequality among several demographic lines, race being the most pressing and obvious example. Looking on a macro scale though, the feeling that Cuyahoga County is on its way up is a position much more supported by evidence than some of the jokes and jabs leveled at the city of Cleveland.
Things to study further that help add nuance and clarity to this picture include a deeper examination of inequality among several lines- especially with municipalities within the county and race, which are highly interrelated concerns with the economic makeup of the area’s economy. Furthermore, a comparison of these trends to similar area like Wayne County (Detroit) and Allegheny County (Pittsburgh) would further illuminate the health of Cuyahoga County’s economy.